
Category Archives: Articles

‘Bus Back Better’ – Transport Geographers are vital to its success

John Austin writes a blog-piece about why Geographic Toolboxes & Skillsets are essential for delivering the strong bus networks envisioned in England’s new National Bus Strategy. And why, in his view, lessons from Research with a Transport Geography focus are vital to understanding what does and what does not work

This article originally appeared as a posting on LinkedIn

——————————————————————————————

The long-awaited National Bus Strategy for England was finally launched on March 15th, with the personal stamp of the Prime Minister: “I love buses” he writes in his Foreword.

It’s visionary, with a statement that ‘Buses are at the centre of the public transport network, making 4.07 billion journeys in England in 2019/20, more than twice as many as the railways’, leading its Introductory chapter. It’s also written with a desire for rapid progress. ‘Buses are the easiest, cheapest and quickest way to improve transport.      Better bus services can be delivered in months.’

Yet it’s also prescriptive, with the government offering the continuance of the discretionary public money that the industry needs as a result of the pandemic ONLY in return for a commitment to establish Enhanced Partnerships (or to begin the statutory process of Franchising) by each of the 81 English Local Transport Authorities (LTAs), together with the writing of a Bus Service Improvement Plan. This money is in the form of CBSSG (COVID-19 Bus Services Support Grant): there to maintain local bus networks as we begin to emerge from the pandemic, with a continued lower level of bus patronage as we stay at home and as our commuting patterns reflect a permanent change from Covid-19’s legacy.

Those actions by LTAs are required very quickly: with the commitments as above required by the end of June this year, and the publication of a local Bus Service Improvement Plan (to be updated annually and reflected in the LTA’s Local Transport Plan) needed by the end of October. From April 2022 LTAs will only be able to access the new discretionary streams of funding available if by that date they have an Enhanced Partnership in place or are following the statutory process required to consider a franchising scheme.

That will require a lot of work, in order not only to deliver Agreements and Plans that tick the government’s boxes but, of course more importantly, also to ensure that they are both ‘fit for purpose’ and are the RIGHT ones. In his always-excellent Bus and Train User blog, referring to theNational Bus Strategy, Roger French writes ‘One of the few detailed funding commitments in the document is £25 million to give “LTAs the skills and people they need to deliver this strategy” in 2021/22. Frankly, there’s only one thing worse than remote based bus company management designing bus networks for local areas, and that’s even remoter based consultants advising unskilled local authorities what their local bus network should look like.”

To help avoid that potential disaster Local Authorities and operators would be very well-advised to have Geographers at the heart of the teams delivering this. The National Bus Strategy has ‘Geographic’ written all over it. People with interpretive geographic skills, an understanding of geospatial software, and the ability to quickly gain local knowledge, or possessing it already – a key skill of geographers – will be essential practitioners right at the heart of delivery of the strategy.

Geography generally is about seeing the relationships between different places, different communities and different objects and about drawing the implications; about identifying patterns in the data based on evidence; about seeing how and why some things pertaining to spatial relationships change over time and why others stay the same.

Economic geographers understand how and why these relationships impact on the economy – through their effects on individuals, on businesses, on institutions and on the economy generally. Geographic Information Systems (GIS) specialists understand the minutiae, the benefits, and the pitfalls, of the software systems and processes used to model geographic behaviour and relationships. And transport geographers bring all these together with their analysis focussed on flows, movement, and transition.

What will the National Bus Strategy have to deliver if it is to succeed? Well, first of all, better performance. There will be no increase in bus service patronage, no making buses a mode of first choice rather than of last resort, no raising of the product quality, without bus priority to give better reliability. And the Strategy states that ‘There must be significant increases in bus priority’. That requires geospatial data on the details and the patterns of where buses are at different times of day and under different conditions; and it requires the bus operators, in partnership with the local transport authority, to have both the software and the trained, experienced control staff to enable a quick response to situations on the ground.

In the largest of the big cities – those with Mayoral Combined Authorities – Key Route Networks, with (the implication) key bus corridors – will need to be defined and controlled according to the Bus Service Improvement Plan. This will require an understanding of the relationships between different sections of route, and between different communities served by those corridors.

The National Bus Strategy places great emphasis on Networks and it recognises the importance of the relationship between services, places, times, and area features. It acknowledges that different areas need different types of networks (e.g. ‘Superbus networks for “intermediate” areas – neither fully urbanised nor deeply rural’). This requires geographic understanding. The link between areas is recognised in the Strategy through the desire for more through fares, easily available.

This link is also acknowledged in the desire to have integration of service patterns between modes: ‘Railway stations should be hubs for connecting services with high quality stops close to station entrances. Schemes that move buses further away from stations should not be allowed’. Bus network design and scheduling skills will be needed, with the ability to recognise and design flexible, attractive, demand responsive services, centred around hubs.

Place Design is also important to designing bus networks that are attractive. Geographical concepts of proximity, connectivity and links are all critical, and Local Transport Plans will be encouraged to recognise that, being centred on place-based strategies with a place-based approach to investment. At a more detailed level, local geospatial data is important, with a need to have accessibility data about bus stations and bus stops. The National Bus Strategy assures us that the government ‘will make sure that apps can provide passengers with accessibility data about bus stations and stops’.

This emphasis on both timeliness and accuracy is also shown in the Strategy’s call for up-to-date static and understandable passenger information, of which geospatial accuracy is a key part. ‘A number of apps and websites give inaccurate information when tested. Web searches for particular routes often also bring up old timetable PDFs which have since changed. Every town, city and rural area should have published, up to date maps.’

All this is great – as long as the funding is there. In referring to the £3bn ‘new funding’ Roger French writes in his blog “Let’s not get too dewey eyed about an amount previously unheard of in bus sector financial support circles because it’s got to last for five full funding years. And not just five unprecedented years of an inevitable slow recovery from the Covid shock of plummeting demand and changed lifestyles and travel patterns but a five year period of funding unprecedented aspirational improvements for buses that this strategy promises.”

When the funding runs out there will be an inevitable danger that activity in the bus sector will be cut back sharply (as has happened on occasions in the past). So it is essential that in this period there are lessons learnt about what works and what doesn’t, and also a monitoring of how realistic the Bus Service Improvement Plans have proved to be. All these provide invaluable lessons for the future. This is where Research with a Transport Geography focus will come into its own as the spatial thinking involved in that will be essential to a full understanding.

In my view the research should be objective-driven and focused on one (or two or all) of three areas. Firstly, the commercial needs of partners: notably bus operators, but also any partner organisation providing services, infrastructure or facilities supporting bus networks. Secondly, of course, bus passengers and bus potential passengers. Thirdly, the policy and community objectives of partners involved in bus networks and of the groups they represent. This group of partners will be most notably local authorities and other relevant public sector bodies; but could also include community organisations and business entities.

There will be several key areas for research which involves spatial relationships and relies on geographic insight as a major element. One major one is sustainable business models to take us beyond the £3bn new funding. Another is research into principles and success factors for the design of networks, nodes and links which involve fast bus corridors and cost-effective demand-responsive services enabling connectivity into and out of the nodes. A third is research into the usability of and attitudes towards the maps and interchange features introduced as part of Bus Service Improvement Plans. There are many more.

If Geographers are not involved at the heart of rolling out and monitoring the National Bus Strategy then government, operators, their passengers, and the whole community will have lost out.
E-bikes? Congratulations to Paul Plazier, TGRG postgraduate prize winner

TGRG would like to congratulate Paul Plazier from the University of Groningen for being awarded first prize in the Transport Geography Research Group postgraduate paper prize for his presentation, The potential of electrically assisted cycling in the everyday commute – a mixed methods approach. The prize is sponsored by Emerald.

The Postgraduate Paper Prize is awarded to the best conference paper presented in a TGRG-sponsored session at the Royal Geographical Society (with the Institute of British Geographers) Annual Conference.

Paul’s presentation slides and paper abstract are below.

[slideshare id=67614543&doc=plazierebikesrgspresentation-161025072811]

The potential of electrically assisted cycling in the everyday commute – a mixed methods approach
Paul Plazier (University of Groningen, The Netherlands)
Gerd Weitkamp (University of Groningen, The Netherlands)
Agnes van den Berg (University of Groningen, The Netherlands)
E-bike use in the Netherlands is growing fast. When substituting motorized travel, it can play an important role in developing sustainable transport systems. This study assessed travel behavior of e-bike commuters, their motives for e-bike adoption and daily use, and
experiences on the road. We GPS-tracked outdoor movements of 24 e-bike users in the
north of Netherlands for two weeks and used their mapped travel behavior as input for
follow-up in-depth interviews. The majority of the commutes was done by e-bike, altered
with car use. E-bike use was highest in work-related, single-destination journeys. It gave
participants the benefits of conventional cycling over motorized transport (physical, outdoor activity) while mitigating relative disadvantages (longer travel time, increased effort). E-bike commutes took longer compared to other modes, but this was deliberately traded for the experience of cycling. In route choice, participants were inclined to choose enjoyable itineraries over shorter or faster routes. Results support that e-bikes can substitute motorized commuting modes on distances too long to cover by bike, and stress the importance of subjective experience in e-bike commuting. This provides impetus for future actions to encourage commuting by e-bike.

Can One Day Without Cars Really Change Our Travel Habits?

Jillian Anable, University of Aberdeen

It is said that on average, we take 66 days to form a new habit. So when an initiative sets out to change our habits in just 24 hours, there’s cause for scepticism. World Car-Free Day aims to do just that. The thought is that by closing city centres to cars for one day a year, people will make a long-term switch to alternative modes of transport and help us to address the many problems caused by our dependence on cars.

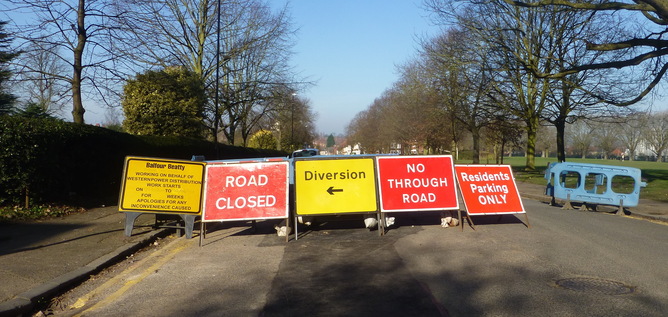
Car-free days have been running for almost 20 years, with cities as far afield as Washington, Paris, Brussels, Stockholm and New Delhi participating. And though the impact of these initiatives has not been well evaluated, there are studies which suggest that events which disrupt the transport system can lead to longer term behaviour changes. Strikes and road closures, for example, force people to try something different, and alter their knowledge and perceptions of the travel alternatives on offer.

One worldwide 2002 study of over 70 road closures due to natural disasters and planned roadworks found that, on average, 11% of vehicles previously using the road could not be found in the surrounding area afterwards. A more recent study on the impact of strike action on the London Underground in February 2014 used data from travel cards to examine travel patterns before, during and after the strike. It found that 5% of travellers carried on using their newly discovered routes after the disruption was over.

Please use an alternative route.
Ian Halsey/Flickr, CC BY-NC

While these findings sound encouraging, it’s worth questioning whether the changes to travel patterns after a disruption are any greater than the day-to-day variability we see anyway. And if they are, there’s still no guarantee that enough people maintain these changes for long enough to alter overall travel patterns, such as the total kilometres driven from one year to the next.

A three-year study on these topics confirmed that individual travel patterns undergo significant day-to-day and year-to-year churn. For instance, although over half of those who were asked by the researchers before and after the 2012 Olympics in London said they had changed their journeys to work during the games, three quarters said they did not always travel to work the same way on a typical day anyway.

Similarly, half of council employees in York revealed they could not be certain how many days they would travel in to the office in the following week. The study revealed that these variations were due to myriad reasons, from changing family and work schedules, avoiding bad weather or just feeling like making a change.

Get multi-modal

But if there’s so much churn and flexibility in the system already, why is it so difficult to achieve deep reductions in car use? For these reductions to materialise, we need more people to avoid taking single occupancy journeys in their car more of the time, so that being “multi-modal” – that is, relying on more than one mode of transport – becomes the norm.

But to achieve this, we’ll need a much broader understanding of how and what shapes people’s travel choices in the first place, and how this varies across locations and societal groups. The three-year disruption study suggests that we should think about these issues in terms of a broader “mobility system”.

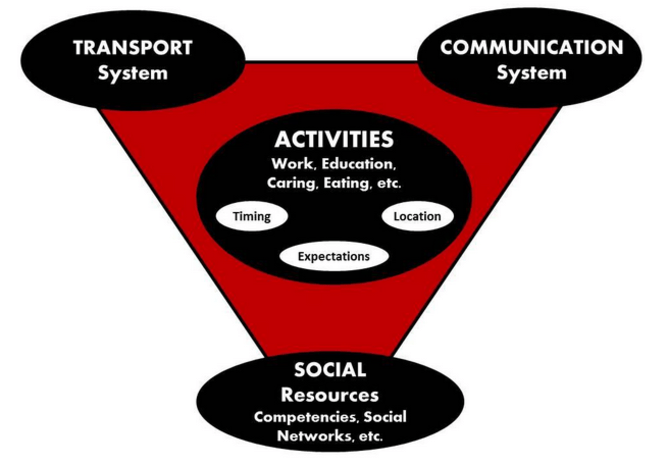
The mobility system includes not only the transport system (infrastructure, legislation, fiscal arrangements like charges and fares, and public transport operators), but also the communication system (patterns of work, shopping and socialising as well as the information we use on the go) and the social context (the norms about how things are done, the know-how and resources of those in the system, including workplaces and communities).

At the centre of the mobility system are the activities which each generate travel and are influenced by the institutions and expectations in the system, such as school start and end times, or standardised business hours.

The mobility system.
Jillian Anable/Disruption Project, Author provided

Unfortunately, the supporters of car-free day – like most policy targeting transport patterns – fall into the trap of thinking that altering the transport infrastructure and services is all that’s required to alter travel behaviour. While these initiatives can play a role in changing the behaviour of some people, for one day, occasionally, it is far from adequate to influence longer term changes at the scale required. Instead, we need to make changes across the whole mobility system, to continually reinforce greater uptake of alternative transport methods.

Flexible working hours, which relax rigid time and place constraints is an important part of the solution, as is wraparound childcare (such as before- and after-school clubs) to allow flexible schedules. Transport system solutions include payment systems to cater for multi-modal journeys such as the Mobility Mixx card in the Netherlands, which can be used to pay for all public transport, taxis, car pool, bike and car rental and park-and-ride tickets. Another option is seasonal reallocation of road space to pedestrian spaces or non-motorised road users as they did in New York.

We need to think more carefully about how, where and when activities are carried out, and then look at how transport provision fits with that. Only then could car-free days go from being rare annual events to part of making non-car journeys more likely, more of the time.

The Conversation

Jillian Anable, Professor of Transport and Energy Demand, University of Aberdeen

This article was originally published on The Conversation. Read the original article.

What happens when we stop asking people what they think?

Accessibility, the ease with which an individual can get to destinations, is now well established as a social justice issue in transport planning. In 2003, Making the Connections, a report by the Social Exclusion Unit highlighted poor accessibility as one of the multi-faceted aspects leading to social exclusion. This resulted in many transport practitioners engaging with issues of transport-related social exclusion and issues of inequality through the process of Accessibility Planning. However, efforts were largely focused around the quantification and measurement of access to destinations in order to produce threshold based accessibility targets. A database of accessibility statistics covering the whole of England at zone level was also produced. Such attempts at quantification have been critiqued, especially in the context of understanding social exclusion, for their black box approach, which fails to understand the lived experience of (in) accessibility and its potential impacts.

However, another source of data, the National Travel Survey (NTS) has been largely underutilised in this regard. Between 2005 and 2012 there was a bank of questions in the NTS, which asked how long it would take respondents to reach the nearest of each of a set of destinations using public transport or walking; this has recently been replaced by a computer generated ‘objective’ measure [i],[ii].

Increasingly, moves towards big data and the ability to link to administrative records means that we may be able to replace information previously asked in social surveys with official records. For example, rather than asking people about their health, we might be able to access their health records. But there may be some cases, where understanding an individuals’ perception of their health is more important than a record of visits to the GP. It is therefore crucial to be clear about what we can and cannot understand by asking certain questions in a survey, or by replacing them with information from large scale datasets. The same applies to the replacement of this set of questions in the NTS with objective measures.

It seems timely to consider what might be gained from including the question regarding self-reported journey times to destinations and what the implications of excluding it might be in terms of our understanding of accessibility. What does this change in measurement technique mean for the way in which we understand accessibility to local services based on the NTS data and does the move away from self-reported data have any implications?

According to the NTS guidance, the previous question in the survey was an objective measure:

“These questions are measures of fact, not of opinion. Interviewers are encouraged to make use of information other than that provided by the household if this provides a more accurate indication of the true position. ‘Walk time’ assumes a walk speed of three miles per hour, and takes no account of, for example, any infirmity or disability of the respondent” (NTS 2006, p.60)[iii].

On this basis, the move in the latest NTS to include ‘objective’ measures of accessibility calculated using TRACC, utilising geo-coded destinations and public transport timetables based is a positive development towards including a measure which is more comparable across the sample and is not affected by individual’s experience of the time taken or definition of what might constitute a grocery store, for example. However, while the objective potential accessibility provided by the transport and land use system is important for understanding the opportunities an individual does or does not have, when trying to address issues of transport and social inclusion it might be that how an individual perceives or really experiences accessibility is more important in determining their travel behaviour, and subsequently outcomes which may or may not contribute to processes of social exclusion.

In the National Travel Survey, there is however no indication of whether interviewers did override respondents answers or not and given that responses are self reported (either by the respondent or the interviewer) they are by nature subjective and likely to be influenced by individuals’ abilities and constraints, rather than being an indication of any ‘objective’ or ‘factual’ level of service provision. I have previously compared the NTS survey question to another nationwide objective dataset of public transport journey time access to destinations, the DfT Accessibility Statistics using data from the same year and at comparing at the postcode sector level and found socio-spatial differences between self reported and objective measures. The very fact that differences exist, suggests that the NTS was not as ‘accurate’ as an objective measure as was intended, again supporting the change of methodology towards one which does not rely of self-report or interviewer reports. However, the fact that differences exist also highlights that there is variation in self reported levels of accessibility compared with objective measures, which has implications in terms of policy interventions and targets to improve accessibility.

The new linked data includes a caveat that it is not directly comparable to the previous questions due to the change in methodology. This is clear from Figure 1, which shows clear shifts in the proportion of the population with access to each type of destination between 2012 and 2014. While not dramatic they do show a clear departure from previous trends and extrapolated to the population might have considerable impact. For example, the increase from 22% to 25% of the population having access to a hospital within 15 minutes, equates to 1.8 million people (based on 2012 and 2015 mid-year population estimates for England). This might have substantial implications for planning and policy decisions around accessibility to hospitals, and lead to a possibly incorrect assumption that accessibility has improved against targets.  It is clear that the change in methodology has affects destinations differently, some showing and increase and some a decrease. It is also likely that there change has differential impact geographically and across socio-demographic groups. Unfortunately, by not including the two approaches in the same survey year, it is not possible to evaluate the impact of this change in methodology, although we can speculate as to what some of the implications might be, it is not possible to control for any actual changes over time.

Figure 1 suggests that there may be a difference in the definition of destinations between self-reported responses and the dataset used to calculate objective measures. The increased proportion of the population who can reach a hospital, GP or post office according to the new measure might be interpreted as meaning that there are more destinations in a national dataset than would be considered in a subjective choice set. On the other hand, we might assume that, particularly for hospitals, these are infrequent journeys which might be reported times are longer due to unfamiliarity. Familiarity has previously been reported as a reason explaining the ‘accuracy’ of journey time estimations.

NTS_figureAC
Figure 1 – Percentage of population who can access a given destination within 15 minutes by public transport or walking based on the National Travel Survey 2005-2014 (excluding 2013). For some destinations the data for 2008 has been imputed by taking the mean of 2007 and 2009 as the data is not available for all destinations for this year.

Individual difference is one of the main reasons for disparities between the two types of measure. A place based measure cannot encapsulate the different travel experiences of all those living in a particular place. In my thesis I found that older people and car drivers reported longer journey times than measured objectively.  There are two potential mechanisms at play here: in some cases differences occur because of inaccuracies in objective measures, for example because of the spatial scale used or the destinations included; differences may also occur because self reported measures are not accurate, relative to the objective measure. Differences may occur because an individual is not aware of a particular journey or destination, issues of familiarity or perceiving unfamiliar journeys to be longer than they are, or because a journey actually does take longer for an individual than an objectively measured average, because of mobility constraints such as children or older age.

Therefore, for some population groups, the differences between the TRACC and survey question data may be much larger than others, which leads us to think about what implications this might have for issues of social inclusion in transport planning. While contour mapping and cumulative accessibility measures might demonstrate that certain population groups are more likely to be at risk of transport related social exclusion, the fact that some of these groups may perceive accessibility to be worse than an objective measure would suggest could mean that they are at even greater risk of social exclusion. On the other hand, people may adapt to adverse circumstances and therefore not report problems, highlighting the need to compare self reported measures to objective measures.

If we can calculate public transport accessibility to destinations at the population level (using either the CAI or TRACC) then the value of attaching this data to a representative sample and then using this to extrapolate to the population seems limited. Would it not be better to have the national dataset available separately and keep the NTS as a survey which can be linked to a whole range of other data sets? One clear benefit, of course, is the ability to link data regarding accessibility to destinations to the rich information available in the NTS, which presents a range of research opportunities outwith the scope of the discussion here. The NTS had value in understanding how individual’s experiences might differ from an objective ‘norm’ (or at least a self reported measure, which did not intend to represent an objective reality, would).

The NTS is a continuous survey, designed to measures change over time. The change of methodology undermines this role. It should be remembered that the DfT reverted to traditional travel diary methods following a trial of using GPS to replace the traditional travel diary element of the NTS due to large discrepancies which meant that the use of the NTS as an ongoing measure of travel behaviour would be limited. This is not to say that the GPS data, or in this case, objective measures of accessibility are not useful, but it must be remembered that they measure something different to questions asked in a social survey. The nature of the knowledge is different, and evidence showing differences should make it clear that we need both kinds of knowledge to address issues of inclusion in transport.

The focus here has been on journey time, which is an important component of accessibility to destinations. However, for those at risk of transport related social exclusion, it may not be the most important factor and more work is needed to understand the importance of other aspects of accessibility across the social spectrum. A greater understanding of how perceptions differ from objective measures, for whom and why is crucial to addressing exclusion as it might illuminate why some groups feel unable to access destinations, despite measures which otherwise suggest reasonable levels of accessibility.

Transport planning has been criticised for its positivist approach, considering averages and not individuals’ experience. In this regard the change in methodology would appear to be a backwards step, moving away from understanding how individuals experience access to destinations. Of course, both approaches to measurement are needed if we are to make any progress in improving accessibility against a baseline. But while much academic research and professional practice has focussed on objective measurement of accessibility, perceptions have recently been highlighted as an important area for future research, at the very same time as the NTS is moving away from asking people what they think in favour of trying to capture the ‘reality’.

[i] NTS, 2014, Technical Report: https://www.gov.uk/government/uploads/system/uploads/attachment_data/file/457690/nts2014-technical.pdf

[ii] https://www.linkedin.com/groups/4246233/4246233-6045492862064353284

[iii] NTS, 2006. National Travel Survey ( NTS ) data 2002-2006 : User guidance.

Thanks to Julie Clark for comments and proofreading

Mobility: A New Urban Design and Transport Planning Philosophy for a Sustainable Future

This brand new book by John Whitelegg of the Stockholm Environment Institute sets out a rationale for a transformation of the mobility  landscape and argues that the sustainable transport options simply cannot thrive in a world that remains wedded to more mobility and the manifestations of that cultural and political bias (subsidy, infrastructure and an astonishing lack of attention to death, injury, air pollution, climate change and social justice).  See here for more information and await a review in the TGRG.

Continue reading Mobility: A New Urban Design and Transport Planning Philosophy for a Sustainable Future →

A summary of TGRG activity since 1996

The Transport Geography Research Group was inaugurated in in 1972.

Since then it has been an active group involved in a wide range of activities many of which have been summarised through the Transport Geography Research Group Page. To provide an appreciation of how activities have developed over time we share open access versions of the  TGRG page from 1996 until the present day.  These TGRG reports are available through our ‘History’ page.

Each of the articles was originally published in the Journal of Transport Geography and is also available through Science Direct.  These are  shared with the kind permission of Elsevier and are subject to Copyright.

RGS-TGRG Writing Transport Geography Workshop

In April 2014 the Institute for Transport Studies at the University of Leeds hosted 21 delegates from the University of Leeds alongside other British and European Universities for a workshop on “Writing Transport Geography”. TGRG Postgraduate reps Ian Philips and Joanna Elvy successfully won a grant from the Royal Geographical Society to host a workshop, which was aimed at encouraging interdisciplinary engagement amongst postgraduate and early career researchers from a variety of disciplines engaged in research with a transport geographical nature.

The one day session included a keynote address from Dr Karen Lucas exploring writing and publication from both the academic journal and policy perspectives (Lucas1_slides / Lucas2_slides). Cristina Irving Turner from Emerald also gave delegates a publisher’s perspective on writing for transport geography (Cristina-Irving-Turner_slides). Nine postgraduate and early career researchers also presented papers outlining their own research which generated lots of discussion and ideas for further work. Their papers included:

  • Anna Davidson (University of Oxford) – Bringing into conversation queer and material feminist theory to understandings of urban cycling practices (Think Piece) – Davidson_paper / Davidson_slides
  • Reka Solymosi (University College London) – Mapping Fear of Crime as a Dynamic Event in the Whole Journey Environment – Solymosi_paper / Solymosi_slides
  • Dr Giulio Mattioli (Univeristy of Aberdeen) – Car dependent practices: initial findings from a sequence pattern mining study of the 2000 British time use survey – Mattioli_slides
  • Daniel Oviedo Hernandez (University College London) – Transport strategies in a context of social and spatial peripheries in Colombia – Oviedo_paper / Oviedo_slides
  • Wojciech Kębłowski (Université libre de Bruxelles) – Mobility of alternative urban transport policies – Keblowski_paper / Keblowski_slides
  • Anna Plyushteva (University College London) – A Journey of Habits: Making, Sustaining and Transforming Everyday Urban Mobilities – Plyushteva_paper / Plyushteva_slides
  • Ersilia Verlinghieri (University of Leeds) – Planning for resourcefulness: a participatory approach to transport planning – Verlinghieri_paper
  • Nicole Badstuber (University College London) – Governance structures and policy frameworks of public transport systems (Think Piece)
  • Alison Rumbles (University of Plymouth) – A critical evaluation of ITSO Smart Ticketing, policy, practice and outcomes (Think Piece) – Rumbles_paper / Rumbles_slides

The day ended with a review session and social networking event which enabled delegates to further discuss the themes that had arisen during the workshop. The TGRG would like to thank all delegates and speakers for attending and also for individual permissions to reproduce the materials from the workshop.

Modelling energy and carbon dioxide emissions from transport

I attended the annual GIS Research UK conference (GISRUK) last week and have some very interesting work to report back to transport geographers.

Transport Geography and GIS have much in common, yet there is relatively little in terms of joint research spanning both fields. There have been efforts to overcome that, with many researchers proudly donning both GIS and Transport hats. There has, for example been a recent Special Issue on Geographic Information Systems for Transportation in the Journal of Transport Geography, as well as papers illustrating the benefits of linking transport models to GIS systems (e.g. Lektauers et al 2012). Despite this progress, there is much to do in terms of collaboration between the fields.

This article reports three papers at the intersection between Transport Studies and GIS, two of which were presented at the conference.

Continue reading Modelling energy and carbon dioxide emissions from transport →